top of page

Hindsight is 20/20, Dublï sees clearly the first time.
Role: Product Designer
Team: Front-End Engineer, Communication Specialist, Business Development Lead
Tools: Adobe Suite, Miro, Figma, Invision, & Typeform
Deliverables: Logo, Branding, Copy, Pitch Deck, UX Research, Prototype
Goal: Design an app to give users confidence in what they are eating.
Problem

Food-sensitive populations can be ruled by the fear of eating the wrong ingredient and become isolated by that constant struggle.
Solution:

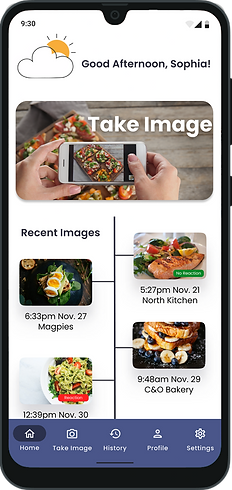
After an image is captured by the user, Dublï detects restricted ingredients they have previously selected in their personal profile and returns an estimation of the likelihood that the food contains those ingredients. The user can now make a more informed decision before eating.

Roadmap
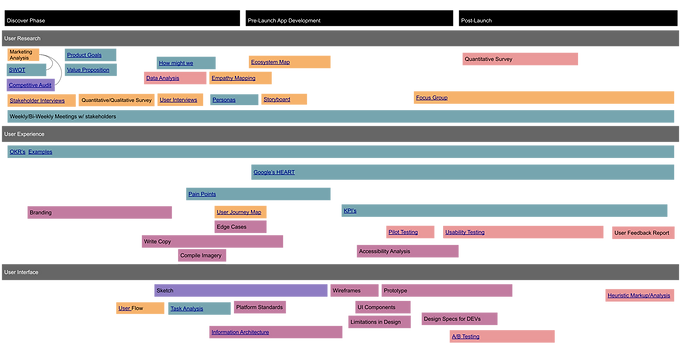
To keep the team on the same page and to give stakeholders a timeline I planned product development from the discovery phase to post-launch.
Competitive Analysis
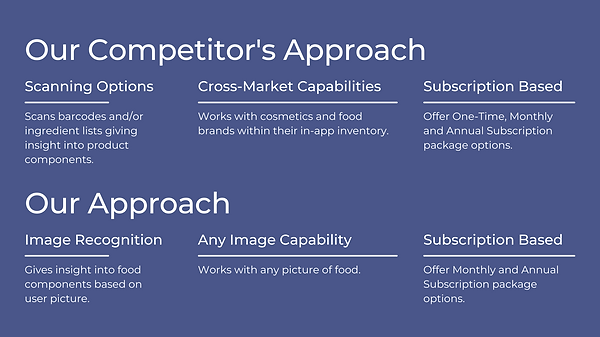
To better understand business needs I researched the functionalities currently offered in the market and app prices. Compared to Dublï I presented to the CEO gaps in the market, functionality enhancements, and possible price points.

Market Research
Market research helped dictate potential user groups which were confirmed through the survey.

Survey Logic
For our initial survey, we planned to reach a wide range of user groups and gain as much initial understanding as possible. We were able to split the survey up into multiple sections based on market research to determine user groups and behaviors.

Survey Results
The main constraint for the initial survey was the lack of funding so we utilized social media to garner as many responses as possible.
Unexpectedly we found that individuals who knew someone with a food allergy were more concerned about them having an allergic reaction than those with allergies. This showed an unexpectedly strong user group so I designed a functionality allowing users to create different food component profiles to use for friends or family.
When designing the survey we stretched the length to try and get as much information as possible causing the bounce rate to be considerably higher than average. In the future, I will plan specific objectives and ensure all questions link back to those objectives.
Lesson Learned
Likert Scale Results


In a social setting, have you experienced health uncertainty or anxiety in relation to
your food allergy?
55.6%
say yes.
someone close to you's food allergy?
50%
say yes.
your food intolerance?
40%
say yes.
your health-concious eating habits?
26.7%
say yes.
"Just having the uncertainty of what’s in a dish in itself is unnerving."
Empathy Mapping
To better understand the different emotions and motivations of each user group I made an empathy map for each one. This helped pinpoint what functionalities each group would care about the most.

Brainstorming
I sketched to brainstorm options for what would be the most important information to the user and possible home screen designs.

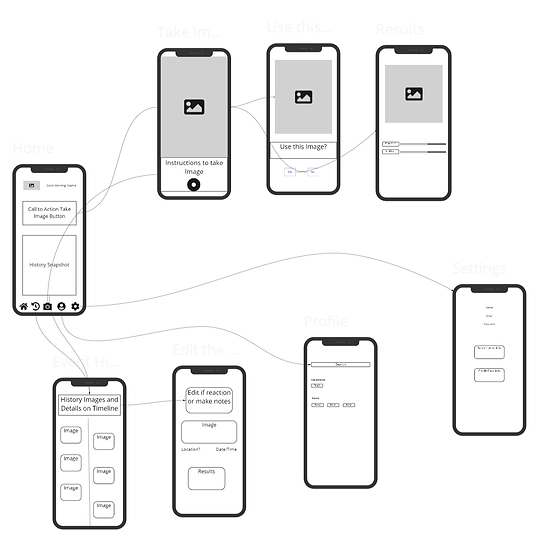
I sketched the user flow to better understand user needs, information architecture, and questions that needed to be further researched.

Sitemap

Wireframes
&
User Flow
Results
Home
Settings
Confirm Image
Take Image
History
Edit History
Profile
Prototype
bottom of page